Do you have data that you haven’t touched in a long time? Some fairly recent studies have shown that data is getting colder. That is, data is not being used for a long period of time. This article examines this trend beginning with a review of an enlightening study about data usage. To help you […]


Do you have data that you haven’t touched in a long time? Some fairly recent studies have shown that data is getting colder. That is, data is not being used for a long period of time. This article examines this trend beginning with a review of an enlightening study about data usage. To help you take the temperature of your data, we present two tools that can provide useful information about your data.
The one universal cry from users is, “I need more space”. I think everyone who has been a user, an administrator, or even a CIO controlling a storage budget, has heard this cry and perhaps uttered it themselves. The user requesting extra space promises their administrator that they either compressed, erased, stored, archived, or otherwise been miserly with their storage allocation. For the most part they aren’t intentionally being misleading but they truly need the space to continue their work. Otherwise their work can come to a grinding halt (not a good thing). This constant need for space has led to the fundamental theorem of storage
“Data will always expand to fill the space allotted“
Data storage management and growth are key issues facing the IT world and like the proverbial ostrich with its head in the sand, people are ignoring the issue by not planning. A key part of planning is understanding how the current data is being used. For example, is the data being accessed (used) on a regular basis? Is the data being updated or modified regularly? How often is the data accessed? How fast is the total amount of data growing? Are the files changing in size? While not providing a complete answer, answering questions such as these can help administrators understand how the data on their storage is being used. I sometimes use the phrase “data thumbprint” for information about the data on my storage.
One the key items that people discover when they start to study the data on their storage, is that the age or how often the data is used is much older than they thought (in essence the data is colder than they thought). For example, if you examined even your home system I bet you find data that is not related to the operating system or applications that is almost as old as your system and has not been accessed in quite some time. So you have “cold” data that hasn’t been accessed in a long time sitting around on your expensive storage, taking up space, and it is not being used for anything (the Cousin Eddy of data). Why are you using expensive, high-performance storage for storing something that is really never used?
A fairly recent study that examined data usage will be highlighted in the following section. Some of the results and the implications are quite surprising even three years after the study was completed so read on.
About three years ago there was a study from the University of California, Santa Cruz and Netapp that examined CIFS storage within Netapp itself. Part of the storage was deployed in the corporate data center where the storage were used by over 1,000 marketing, sales, and finance employees. The second part of the storage was a high-end file server deployed in the engineering data center and used by over 500 engineering employees. All together the storage amounted to about 22TB’s. During the study approximately 2.25 TB’s worth of trace data was obtained (creating data to study data).
In the study they examined the access, usage, and sharing patterns of the storage over a three month period. Using the collected data, they focused their analysis on three items:
The authors divided their observations into two categories – (1) observations compared to previous studies, and (2) new observations.
Below is the list of results compared to the previous study (taken from the paper with some extra comments added).
The new observations reported in the study are:
One observation mentioned in the paper yet wasn’t listed in the two lists was the fact that overall file access was random, indicating the importance of random data performance of the storage medium.
Robin Harris at Storage Mojo wrote a good blog about this study and come up with a very key take-away from the study. From his blog:
Over 90 percent of the active storage was untouched during the study. That makes it official: data is getting cooler.
While one cannot take this data and make sweeping conclusions, it is a very interesting and compelling data point. In particular, there are two important observations that are very pertinent to the discussion in this article:
Based on these observations one can’t help but wonder that if the data is rarely touched, and after a period of time is likely never to be touched, is it really needed on what is presumably fairly fast storage? Aren’t we spending money in terms of power, cooling, and hardware costs to store data that is never used. Wouldn’t it be more appropriate to archive the data onto inexpensive storage?
If we take a step back and if we use this study and prior ones as pointers we can discern a general trend. The general trend is that data is becoming increasingly write oriented and isn’t used much after a small amount of time of its initial creation. I prefer to think of this as the “temperature” of our data is getting colder. While it sounds strange, if you look at the average temperature of your data, it is becoming increasingly colder as time passes yet we keep it on expensive higher performance storage.
Given that many applications, particularly those in the HPC space, are generally becoming more data intensive we are having to use faster and faster storage which also means it is more expensive. So we’re putting data that is increasingly colder on this expensive storage. It therefore seems logical that we should find the coldest data and move it to inexpensive storage (or at least cheaper).
Up to this point it has been shown that it is logical to start moving cold data to inexpensive storage but I’m a big believer in planning before making changes to systems. This is particularly true for data since it is a very precious resource for many companies (and individuals). The start of a good plan is to understand our data by profiling it.
The data profile is useful because it gives us a great deal of information about the “state” of our data. For example, we can collect statistical information about the data such as the following.
We can gather this data on a per file system basis or a per user basis (I like to do both). Furthermore, you can gather this information over a period of time to discover how these statistics are changing over time.
So you have this information about your data temperature. What good is it? We can use this information to answer many questions such as the following:
From all of this statistical information we can create a “thumbprint” of the data and use that to understand what is happening with our system. It takes work to gather all of this information, but it allows you to plan your storage growth and be able to explain it and justify it. Otherwise we’re left with having to react to immediate needs with little thought to how to grow the storage and manage it.
How does one gather all of this information? Are their tools available to do this for me? Well, I’m sorry to say that the answer to both questions is no. As far as I know (and would love to be corrected), there isn’t anything like this. But there are a two tools that point you in the right direction and give you some assistance. The first one is called Agedu.
File systems can have hundreds or even millions of files. Tracking how they are used can be very difficult, bordering on the impossible. Fortunately there is a tool, named agedu, that can give you a quick glimpse into the temperature of the data on a directory basis. The code is open-source and works well on Linux. The author has created a Windows tool that helps in using agedu with Windows as well.
Agedu is simple to install, configure, and run, particularly on Linux (which I’ll be covering in the rest of this article). You build the code with a simple ./configure command that everyone is accustomed to using with open-source code. If you build the code this way it will install into /usr/local so you need to be root for installing the binaries. The other option is to build the code to install into your user account. This is fairly easy to do by telling the configuration to install into your home directory such as, ./configure --prefix=/home/laytonjb/bin/agedu-r8442. Then you just create an alias to the executable. For example in your .bashrc file you add the following line,
alias agedu=/home/laytonjb/bin/agedu-r8442/bin/agedu
(Note: the version of agedu tested in this article is r8442).
After you have installed agedu there are a number of things you can do with it. The first thing that you should do with agedu is create an index of all of the files and their sizes in the directory tree. All subsequent queries can be done against the index (much faster than continually scanning the file system). Note that this means that for all directories and files below the current directory agedu will sum the used storage. Once the index is built you can then “query” it to get a variety of information. Agedu even comes with a basic HTML server so it will produce a graphical display of the results (my favorite option).
To create an index of the directory tree you just run the command.
$ agedu -s /home/laytonjbBuilt pathname index, 46136 entries, 2904994 bytes of indexFaking directory atimesBuilding indexFinal index file size = 5630300 bytes
where the "-s [directory]" produces an index file named agedu.dat in the current directory (Note: if the index file is in a directory being scanned, agedu will ignore it in the output).
Once the index is created you can query it. A great way to get started is to use the HTML display capabilities.
$ agedu -wUsing Linux /proc/net magic authenticationURL: http://127.164.152.163:34815/
Agedu prints out a URL that you can then copy into your browser. Below is a screenshot of the web browser based on the scan of my laptop.
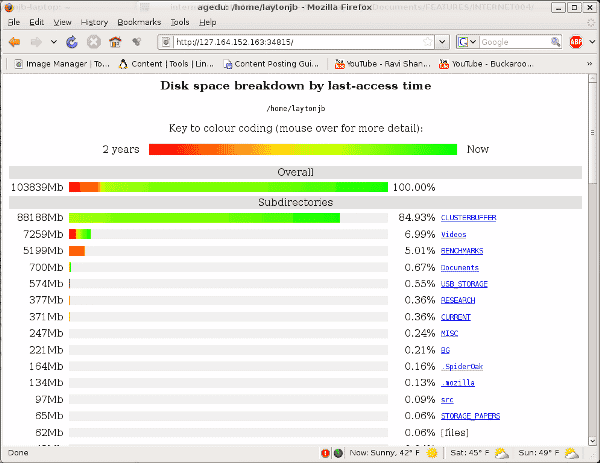
Figure 1: Aegdu Screenshot Using Access Time (atime)
The web graphics display the age of the files (temperature) in a specific directory, red being the oldest (coolest) and green being the newest (hottest). The web page orders the directories by the total space used in the directory. For this specific example the first directory has the vast majority of the used space but the oldest files are either in a directory named “Videos” or “BENCHMARKS”. The image also tells you the total space used in the directories to the far left and what percentage of the total space the directory is using (listed to the far right). When you are finished with the web page, you close agedu by just pressing cntrl-c.
In the screenshot you should notice the very top of the page that states the data age is based on the access time (atime). This is the default setting. However you can easily perform the same thing using mtime if you like (Note: With the version used in this article ctime is not an option).
$ agedu --mtime -s /home/laytonjbBuilt pathname index, 46184 entries, 2907790 bytes of indexFaking directory atimesBuilding indexFinal index file size = 5886872 bytes$ agedu -wUsing Linux /proc/net magic authenticationURL: http://127.164.152.163:36462/
The first command produces the index. Then you need to either display the graphic output as in the second command or otherwise query the output. Figure 2 below is a screenshot of the resulting web page.
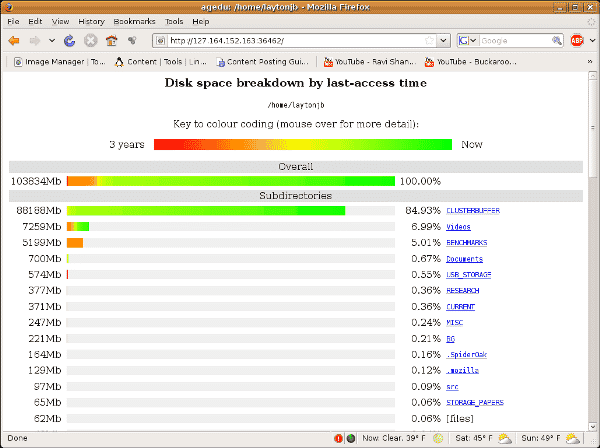
Figure 2: Aegdu Screenshot Using Modify Time (mtime)
The directories “BENCHMARKS”, “USB_STORAGE”, and “Videos” contain the oldest (coldest) modify-time files. Also note that the web page says “last-access” even though the data is “last- modified”. This appears to be a bug in the code.
In addition to the HTML output, you can also query the database to get text information (great for scripting). For example,
$ agedu -s /home/laytonjb$ agedu -t /home/laytonjb
This will send text output to stdout that is a summary of the space usage (Recall that that this includes subdirectories as well). If you use agedu on subdirectories in a script you can gather usage statistics.
Be default agedu looks for the oldest file when creating the scale as displayed in the web output. You can use the text option to query the index for the age of the data that doesn’t have to follow that scale. For example, one can scan for the amount of space in each directory that is older than 24 months by the following:
$ agedu -s /home/laytonjb$ agedu -a 24m -t /home/laytonjb340 /home/laytonjb/.adobe192 /home/laytonjb/.cache168 /home/laytonjb/.compiz112 /home/laytonjb/.config160 /home/laytonjb/.dvdcss184 /home/laytonjb/.evolution172 /home/laytonjb/.fontconfig272 /home/laytonjb/.gconf20 /home/laytonjb/.gkrellm228 /home/laytonjb/.gnome212 /home/laytonjb/.gnupg304 /home/laytonjb/.gstreamer-0.10172 /home/laytonjb/.kde4 /home/laytonjb/.local128 /home/laytonjb/.macromedia2044 /home/laytonjb/.mozilla4 /home/laytonjb/.mplayer328 /home/laytonjb/.nautilus676 /home/laytonjb/.openoffice.org1040 /home/laytonjb/.openoffice.org28 /home/laytonjb/.pulse8 /home/laytonjb/.python-eggs4 /home/laytonjb/.update-manager-core28 /home/laytonjb/.xine5323300 /home/laytonjb/BENCHMARKS225100 /home/laytonjb/BG35540 /home/laytonjb/CLUSTERBUFFER319492 /home/laytonjb/CURRENT8 /home/laytonjb/Desktop313036 /home/laytonjb/Documents10352 /home/laytonjb/G95252280 /home/laytonjb/MISC28000 /home/laytonjb/POISSON_HOME80 /home/laytonjb/Pictures352940 /home/laytonjb/RESEARCH558432 /home/laytonjb/USB_STORAGE1729592 /home/laytonjb/Videos13528 /home/laytonjb/src9168208 /home/laytonjb
This shows the space usage summary for each directory that has data older than 24 months. This capability can be extremely useful to search for directories that have very cold data. From a system administrator perspective a prime example would be to use agedu to scan user directories for really cold data after examining all home directories for the coldest data. This can also be run as part of a script that is run either daily, weekly, or monthly, and creates a report of the directories with the coldest data.
Agedu is very useful to get a graphical view of the temperature of your data, but I was also looking for something that could be easily scripted as part of a larger project. So I started to tinker around with Python and came up with the beginnings of a simple tool. The tool, with the creative name of FS_scan, recursively walks a file system gathering information on the files to get a detailed view of your data. In particular, it will tell you the dates and ages of your files, the average ages of the files in a given directory, and it will tell you the oldest files in the directory tree. It also produces a csv file (Comma Separate Values) that you can open in a spreadsheet. The specific data it gathers is,
FS_scan produces a fair amount of information. The salient aspects of the tool are:
If you search a fairly large directory tree, you can generate a large amount of output. If you want to just get a quick directory level view you can choose a “short” option (e.g. FS_scan.py -short .). This option won’t print any file information to stdout (standard output) but it does print out the three average ages for the files in that directory. It’s not a bad idea to start with this option to get a quick overview of the directory tree and then get a more detailed view on certain parts of the tree.
Here is a sample of the “short” output. Despite using the “short” option, the output is a little long because of the number of sub-tress. So most of it has been truncated except for the first directory and the summary.
Start_time: Mon May 25 10:43:07 2009Starting directory (root): /home/laytonjb/POISSON_HOMECurrent directory /home/laytonjb/POISSON_HOME/ Number of Files: 4 Average Access Age: 0 years 0 months 0 weeks 0 days 7 minutes 17.2 seconds (0.00 months) Average Modify Age: 0 years 5 months 1 weeks 10 days 58 minutes 59.2 seconds (5.04 months) Average Change Age: 0 years 5 months 1 weeks 10 days 58 minutes 59.2 seconds (5.04 months) Oldest Access Age: 0 years 0 months 0 weeks 0 days 9 minutes 28.5 seconds (0.00 months) File Location: /home/laytonjb/POISSON_HOME/parcfdtest.tar.gz File size: 4138 bytes Oldest Modify Age: 0 years 6 months 21 weeks 22 days 38 minutes 41.5 seconds (6.73 months) File Location: /home/laytonjb/POISSON_HOME/sor.ps.gz File size: 129452 bytes Oldest Change Age: 0 years 6 months 21 weeks 22 days 38 minutes 41.5 seconds (6.73 months) File Location: /home/laytonjb/POISSON_HOME/sor.ps.gz File size: 129452 bytes...****************** Summary ******************Total Number of Files in tree: 417Average Access Age: 0 years 0 months 10 weeks 1 days 1 minutes 12.0 seconds (0.33 months)Average Modify Age: 0 years 6 months 21 weeks 3 days 22 minutes 19.5 seconds (6.70 months)Average Change Age: 0 years 6 months 19 weeks 13 days 11 minutes 31.3 seconds (6.65months)Oldest Access Age: 0 years 5 months 29 weeks 14 days 11 minutes 57.5 seconds (5.98 months) File Location: /home/laytonjb/POISSON_HOME/PAPER_CODES/GRID/README File size: 52 bytesOldest Modify Age: 0 years 6 months 21 weeks 22 days 38 minutes 41.5 seconds (6.73 months) File Location: /home/laytonjb/POISSON_HOME/sor.ps.gz File size: 129452 bytesOldest Change Age: 0 years 6 months 21 weeks 22 days 38 minutes 41.5 seconds (6.73 months) File Location: /home/laytonjb/POISSON_HOME/sor.ps.gz File size: 129452 bytesStaring Time: Mon May 25 10:43:07 2009Ending Time: Mon May 25 10:43:07 2009
I think everyone will agree that data is getting colder. With regulatory requirements, user requirements, and business requirements, the IT industry is forced to retain data for a longer period of time. To effectively manage and plan for data growth we need to understand our data pattern. The data pattern can include information such as, “what is the average temperature (age) of the data?”. Or “What user has the coldest data?” Monitoring the “state” of our data allows us to effectively plan for data growth and management. In particular, it allows us to better utilize limited budgets to optimize our storage purchases (i.e. put very cold data on inexpensive storage).
The two tools mentioned in this article, agedu and FS_scan, are just the beginnings of tools to help you profile your data. While they are not complete tools that generate reports and perform in-depth statistical analysis, they can give you a visual snapshot of the temperature of your data and help you to collect information for use in other tools.
Don’t think that profiling your data is something that you can ignore in favor of short term requirements. If you go down this path you become the little boy with his finger in the dike (or all fingers or toes). Instead take an active role in understanding what is happening with your data and use that information to effectively plan for colder data.
Jeff Layton is the Enterprise Technologist for HPC at Dell, Inc., and a regular writer of all things HPC and storage.

Enterprise Storage Forum offers practical information on data storage and protection from several different perspectives: hardware, software, on-premises services and cloud services. It also includes storage security and deep looks into various storage technologies, including object storage and modern parallel file systems. ESF is an ideal website for enterprise storage admins, CTOs and storage architects to reference in order to stay informed about the latest products, services and trends in the storage industry.
Property of TechnologyAdvice. © 2026 TechnologyAdvice. All Rights Reserved
Advertiser Disclosure: Some of the products that appear on this site are from companies from which TechnologyAdvice receives compensation. This compensation may impact how and where products appear on this site including, for example, the order in which they appear. TechnologyAdvice does not include all companies or all types of products available in the marketplace.