


Hard drive reliability has certainly generated research. A highly noteworthy example is the work of (2007), Bianca Schroeder and Garth Gibson a very important paper. It examined the failure rates of drives in real world systems. Several of the systems were from high performance computing (HPC) systems, but some were not. The observations in the paper were very interesting and have gone a long way in influencing how people think about Hard Drive reliability.
Recently, Dr. Schroeder and her co-authors released a new paper that discusses flash drive reliability. The observations in this paper are equally eye opening.
In this article I want to review the article about hard drive reliability to understand the methodologies that were used and how the conclusions were reached. Then I want to turn to the new article on flash drive reliability.
To get an in-depth look at SSD and HDD pricing analysis, see SSD vs. HDD Pricing: Seven Myths That Need Correcting.
In summary of hard drive reliability:
SLC drives are not generally more reliable than MLC drives. Furthermore, flash drives have a much lower ARR (Annual Replacement Rate) compared to hard drives. However, 20 percent of the flash drives developed uncorrectable errors in a four-year period. This is much higher than hard drives. Additionally, 30-80 percent of the flash drives develop bad blocks during their lifetime, possibly leading to loss of data. For hard drives, only 3.5 percent of them develop bad sectors in a 32-month period. The number of sectors on a hard drive are magnitudes larger than the number of either blocks or chips on an SSD. These sectors are smaller than flash drive blocks. Therefore when a sector goes bad, the impact is much less than if a block goes bad (i.e. the impact on the hard drives is less than for a flash drive). 2-7 percent of the drives develop bad chips, which again can lead to data loss.
Hard Drive Reliability Study
The hard drive reliability paper on is truly one of the seminal papers in storage. Even though the paper was written nine years ago, their observations about real world disk failures are worth reviewing. The study included about 100,000 drives from seven sites, four of which were HPC and three of which wer from large Internet Service Providers (ISPs). The drive types included FC (Fibre Channel), SCSI and SATA.
From the drive manufacturers’ specifications (datasheets), the drives have a mean time to failure (MTTF) of between 1,000,000 and 1,500,000 hours. This suggested an annual failure rate of between 0.58 percent and 0.88 percent. Drive manufacturers specify the reliability of their products using two metrics: (1) Annualized Failure Rate (AFR) which is the percentage of disk drives in a population that fail in a test, scaled to a per year estimation, and (2) Mean Time to Failure (MTTF) which is the number of power on hours per year divided by the AFR.
In the paper, Dr. Schroeder and Dr. Gibson reported the Annual Replace Rate (ARR), which is similar in concept to AFR but counts the number of drives replaced rather than failed. To a customer, a drive may need to be replaced if it is identified as the “likely culprit” of a problem and the resulting customer tests show that the drive is faulty and needs to be replaced. Note that this is not the same thing as a “failure” drive in the eyes of the manufacturer although the customer tested the drive and was unable to continue using it (hence the word “replaced”).
At the time, common wisdom said that FC and SCSI drives were more reliable than SATA drives. Dr. Schroeder and Dr. Gibson computed the ARR for each drive type for each center and plotted it versus the AFR from the drive manufacturers. The results are shown in Figure 1 below from their paper.
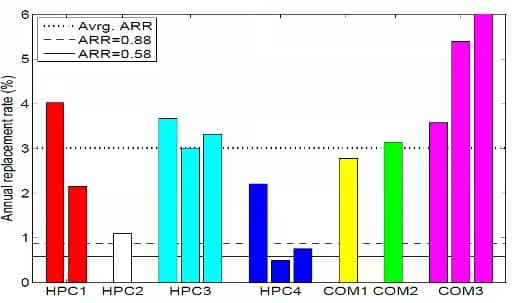
Figure 1 – ARR for the seven centers along with AFR data from drive manufacturers
The drive types in Figure 1 are listed below in Table 1, which is also taken from their paper.
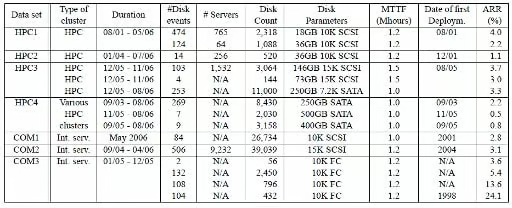
Table 1 – Table of drive types
Note: Only disks within the nominal lifetime of five years are included in Figure 1 (i.e., there is no bar for the COM3 drives that were deployed in 1998 because they are older than 5 years). The third bar for COM3 in the graph is cut off to make the chart easier to read (its ARR is 13.5 percent).
For all of the drives, the overall weighted ARR is 3.01 percent (up to 3.4 times larger than 0.88 percent or about a 1,000,000 MTTF). The ARR ranges from about 0.5 percent to 13.5 percent. Recall that the drive manufacturers were stating that the drives should have an AFR of between 0.58 percent and 0.88 percent. The ARR values are up to a factor of 15 times larger than the drive manufacturers’ data sheets.
Notice that the drives that had the highest ARR were FC drives that were thought to be some of the most reliable drives. The “HPC4” center, which only reported data for SATA drives, had the lowest ARR and in one case it was actually lower than the manufacturer’s data sheet (0.58 percent or a MTTF of 1,500,000 hours). On the other hand, the SATA drives for the HPC3 center didn’t fare as well and had a ARR that is slightly above the weighted average.
The other reliable drive type was widely considered to be SCSI drives. However, Figure 1 illustrates that almost all of those had failure rates close to the weighted average except for the second drive in HPC1 and the drives in HPC2.
Some other observations the authors made were:
- For older systems (5-8 years of age), data sheet MTTFs underestimated replacement rates by as much as a factor of 30.
- Even during the first few years of a system’s lifetime (less than 3 years), when wear-out is not expected to be a significant factor, the difference between datasheet MTTF and observed time to disk replacement was as large as a factor of 6.
- Contrary to common and proposed models, hard drive replacement rates do not enter a steady state after the first year of operation. Instead replacement rates seem to increase steadily over time.
The observations made in the paper are very important because it was the first time a public examination of drive replacement statistics was performed over a large population (100,000 drives). The results were a bit unexpected but pointed out some differences between real-world experiences and what datasheets say.
Reliability of Flash drives in Production
Dr. Schroeder published a new paper at FAST 16 around drive reliability, but this time it was about SSDs (flash drives). Dr. Schroeder, along with two researchers at Google, presented a paper entitled, “Flash Reliability in Production: The Expected and the Unexpected“.
For this paper, they examined the drive reports for ten different drives for millions of drive days (lots of drives over several years) from the Google fleet of drives. They examined three different drive types: (1) SLC, (2) eMLC (Enterprise MLC), and (3) MLC, over a range of feature sizes (24nm to 50nm). They only used statistics from drives that had been in production a minimum of four years and typically about six years of production use. These drives used commodity flash chips from four different vendors. In some cases there was data on two generations of the same drive in their population, allowing them to at least investigate the impact of feature size.
All of the drives were designed for high performance and used a customer PCIe interface. A table of the drives taken from their paper is below in Table 2.
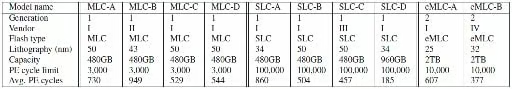
Table 2 – Table of flash drive types
For all of the drives they had access to data regarding daily error counts (several types); daily workload statistics that include the number of read, write and erase operations; and the number of bad blocks developed during the day. Note that the read, write and erase operations were initiated by user processes (reading or writing to the drive) and internal operations from garbage collection operations. They also had the logs of when a chip in the drive was declared failed and when a drive itself was being swapped out.
The most common concern about flash drives is that they wear-out because of the limited number of Program/Erase (P/E) cycles the chips have. A rule of thumb is that SLC (Single-Level Cell) drives have a P/E limit of 100,000, eMLC drives have a P/E limit of 10,000 cycles, and MLC have a limit of 3,000 P/E cycles.
Table 3 gives the number of P/E ratios over the time scale of the drive (3-4 years), for each drive type.
| Model Name | Generation | Vendor | Flash Type | Lithography (nm) | PE Cycle Limit | Average P/E Cycles | Percentage used |
|---|---|---|---|---|---|---|---|
| MLC-A | 1 | I | MLC | 50 | 3,000 | 730 | 24.3 percent |
| MLC-B | 1 | II | MLC | 43 | 3,000 | 949 | 31.63 percent |
| MLC-C | 1 | I | MLC | 43 | 3,000 | 529 | 17.63 percent |
| MLC-D | 1 | I | MLC | 43 | 3,000 | 544 | 17.63 percent |
| SLC-A | 1 | I | SLC | 34 | 100,000 | 860 | 0.86 percent |
| SLC-B | 1 | I | SLC | 50 | 100,000 | 504 | 0.504 percent |
| SLC-C | 1 | III | SLC | 50 | 100,000 | 457 | 17.63 percent |
| SLC-D | 1 | I | SLC | 34 | 100,000 | 185 | 0.185 percent |
| eMLC0A | 2 | I | eMLC | 25 | 10,000 | 607 | 6.07 percent |
| eMLC-B | 2 | IV | eMLC | 32 | 10,000 | 377 | 3.77 percent |
Table 3 – Table of flash drive P/E ratios from the study
Over the minimum of a four-year life for these drive classes, the largest average percentage used P/E cycles was 31.6 percent and the smallest average used P/E cycles was 0.185 percent. After four years of use these are much, much lower than the P/E limits. The obvious conclusion is that P/E cycle exhaustion is not a real concern.As with the hard drive study, the next statistic that was examined was the replacement rate of the flash drives (ARR). The chart is shown below in Figure 2 (taken from the paper).
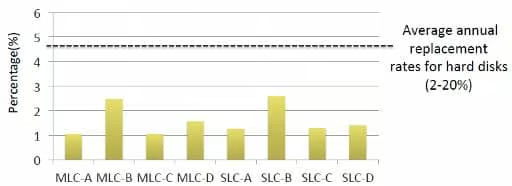
Figure 2 – ARR for eight flash drive types versus hard drives
Around 1-2 percent of the flash drives were replaced annually versus the hard drive average around 4.6 percent. This is a factor of 2.5-4 in favor of flash drives. Remember that this is the annual replacementrate and not the failure rate.To dig deeper, they had access to various error types for analysis. The errors were divided into two classes: (1) transparent errors, where the error was masked from the user, and (2) non-transparent errors, where the user encountered an error. The list below summarizes these errors:
- Transparent Errors:
- Correctable errors – during a read, an error is detected and corrected by the drive’s ECC
- Read Errors – A read operation experiences a non-ECC error but after a retry, the read succeeds
- Write Errors – A write operation experiences a non-ECC error but after a retry, the write succeeds
- Erase Errors – An erase operation on a block fails (this doesn’t impact the user so it’s a transparent operation)
- Non-transparent errors:
- Uncorrectable errors – A read operation that ECC cannot correct
- Final read error – A read operation that cannot be corrected even after multiple retries
- Final write error – A write operation that cannot be corrected even after multiple retries
- Meta error – An error accessing metadata o the drive itself
- Timeout error – An operation that timed out after 3 seconds
Transparent errors are correctable so that the user does not see them in normal operations except perhaps for a brief delay in the I/O. Non-transparent errors will cause an application to either crash or report an error and stop.
Non-Transparent Errors
Non-transparent errors are ones that cannot be corrected even using ECC and multiple retries. From the study the authors found that most non-transparent errors are final read errors (Unrecoverable Read Errors – URE). Depending upon the model of the drive, between 20-63 percent of drives experienced at least one of the errors during the time it was in production. In addition, between 2-6 out of 1,000 drive days were affected.
These UREs are almost exclusively due to bit corruptions that ECC cannot correct. Some people call this bit-rot (bits going bad). If a drive encounters a URE, the stored data cannot be read. This either results in a failed read in the user’s code, or if the drives are in a RAID group that has replication, then the data is read from a different drive.
The authors found that final read errors (read errors after multiple retries) are about two orders of magnitude more frequent in terms of drive days than any other non-transparent (non-recoverable) error.
Given this, the authors wrote that write errors rarely turned into non-transparent (non-recoverable) errors. They found that, depending upon the drive model, 1.5 percent to 2 percent of the drives and 1-5 out of 10,000 drive days experienced a final write error. It’s fairly safe to say that the reason the statistics are so low is that if a write fails on a drive, it can be written to a different location on the drive (of course, assuming the drive isn’t full). A final write error really indicates that there is a larger-scale hardware problem than just a single chip on the drive. These types of errors need to be watched carefully.
Drive metadata errors happen on a frequency similar to write errors. Just like write errors, these happen at a much lower rate than read errors. Timeouts and response errors, indicative of metadata problems, typically affect less than 1 percent of the drives and less than in 100,000 drive days. This makes metadata errors the lowest frequency error encountered.
Transparent Errors
These are errors you don’t see as a user but nonetheless happen within the drive. They are almost always a correctable error (ECC corrections) or a retry within the drive. Correctable errors, which are handled by ECC, are the most common type of transparent error found in the study. According to the study, virtually every flash drive had at least one correctable error during its life.
The majority of drive days, around 61-90 percent, experienced correctable errors. The most common transparent type of errors were write errors and erase errors. Typically 6-10 percent of drives had one of these two errors but some models had 40-68 percent of the drives affected. But less than 5 in 10,000 drive days experienced these errors.
RBER (read bit error rates)
In the paper, the authors state that the standard metric to evaluate flash reliability is the raw bit effort rate (RBER) of a drive. This is defined as the number of corrupted bits per number of total bits read, which includes correctable as well as uncorrectable corruption events.
The paper has a very extensive discussion about RBER and comparing to other errors in the group of drives. They concluded that RBERs were mostly recovered by ECC or occasionally by read retries. Therefore they can be considered transient errors and perhaps were not as interesting to drive reliability as original thought.
Moreover, for drives past their P/E ratio limits, the RBER did not increase as dramatically as was first thought.
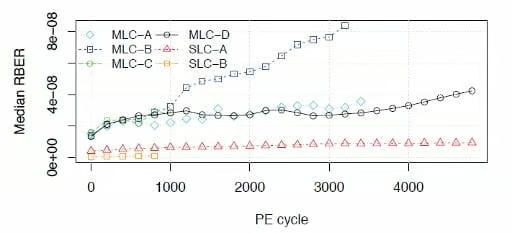
Figure 3 – Median RBER for drive families as a function of the P/E ratio
Uncorrectable Errors
One of the unexpected outcomes from the data analysis was the high level of uncorrectable errors (UEs). The standard measure to report UEs is the number of Uncorrectable Bit Errors per total number of bits read (UBER – not the ride service).
They examined if there were any correlation between the number of bits read and the number of uncorrectable errors and found none. As a result, the authors stated that UBER is not a good measure for flash drive reliability. They also found that RBER is a bad indicator of UEs.
The authors did observe that the daily UE rate has some correlation with P/E cycles. Figure 4 shows a plot of the daily UE Probability as a function of the P/E ratio.
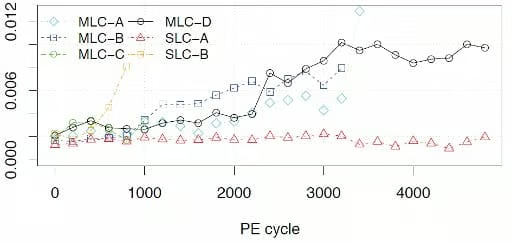
Figure 4 – Daily UE Probability as a function of the P/E ratio
This is the only correlation they found. If a drive had a UE one month, there was a 30 percent chance it would see another one the next month. This can be used as a metric for monitoring drives.
Bad Blocks
The last interesting observations made in the paper that I want to mention are around bad blocks on the drive. Recall that on a flash drive, the block is the lowest level where erase operations take place. Many modern drives have several blocks reserved in case blocks on the drive go bad (the so-called reserved space). The authors of the study looked at the number of bad blocks on drives when they arrived from the factory (“initial bad blocks”) and the number of bad blocks that developed over time.
They defined the a block as “bad” if it had a final read error, a write error, or an erase error and consequently re-mappped to a different block on the drive. When this happens the drive controller marks the block as bad, and it is never used again. Also any data that was on the block that could have been recovered is recovered and written to the replacement block. But note that it may not be possible to recover all the data from the bad block, which is really data corruption.
Table 4 below, which is taken from the paper, presents the number of bad blocks for the various drive types.
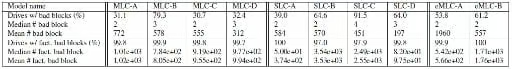
Table 4 – Average bad block count for drives in study
The top half of the table lists the bad block data on each drive model that developed bad blocks in the field (as the drive was in production). It also lists the fraction of drives that developed bad blocks, the median and the average number of bad blocks for those drives that had bad blocks.
The bottom half of the table presents statistics for drives that arrived with bad blocks from the factory (abbreviated as “fact.”). The percentage of drives that come from the factory with bad blocks is extremely large. Virtually every single drive came from the factory with bad blocks. Once class of drives (SLC-A) had every single drive arrive with bad blocks. The median number of bad blocks varied from as low as 50 (SLC-A) to as many of 3,450 (SLC-B). This seems like a surprisingly large number of bad blocks from the factory.
According to the authors, depending upon the model, between 30-80 percent of the drives develop bad blocks in the field (in production).
The authors also looked at the number of bad blocks per drive that are accumulated for drives that started with bad blocks. The median number of bad blocks for drives that started with bad blocks was 2-4, depending upon the drive model. Figure 5 from the paper illustrates this.
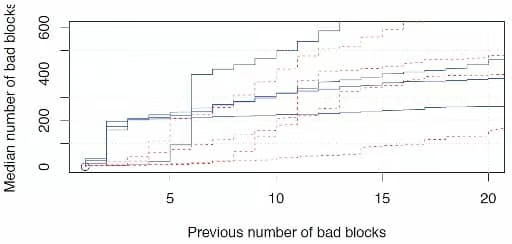
Figure 5 – The median number of bad blocks a drive will develop, as a function of how many bad blocks it has already developed.
The figure plots the median number of bad blocks that the drive develops on the y-axis, as a function of how many bad blocks a drive has already experienced. The solid blue lines are for the MLC drives and the dashed red lines are for the SLC drives.
The authors found that for MLC drives there was a sharp increase after the second bad block was detected. That is, close to 50 percent of those drives that develop two bad blocks will develop close to 200 or more bad blocks in total.
The authors offer the opinion that bad block counts on the order of hundreds are likely due to chip failure. Therefore they conclude that after experiencing a “handful” of bad blocks, there is a high chance for developing a chip failure. Therefore this metric could be used as an indicator of needing to copy the data from a failing chip to another chip in the drive.
Summary
The first paper that Dr. Schroeder wrote with Dr. Gibson on drive reliability is one of the most important papers for data storage. The new paper about the reliability of flash drives is equally as important. The study created a great deal of new and unexpected information.
There were several important observations made from the flash study:
- One of the first observations is that SLC drives are not generally more reliable than MLC drives.
- Another observation is that flash drives have a much lower ARR (Annual Replacement Rate) compared to hard drives (this is good news).
- On the downside, 20 percent of the flash drives developed uncorrectable errors in a four-year period. This is much higher than hard drives.
- 30-80 percent of the flash drives develop bad blocks during their lifetime, possibly leading to loss of data.
- For hard drives, only 3.5 percent of them develop bad sectors in a 32-month period. The number of sectors on a hard drive are magnitudes larger than the number of either blocks or chips on an SSD. These sectors are smaller than flash drive blocks. Therefore when a sector goes bad, the impact is much less than if a block goes bad (i.e. the impact on the hard drives is less than for a flash drive).
- 2-7 percent of the drives develop bad chips, which again can lead to data loss
A simple summary is that flash drives experience significantly lower replacement rates than hard drives. However, flash drives experience significantly higher rates of uncorrectable errors than hard drives. This can mean the potential loss of data, so steps should be taken to ensure no loss of data.
Photo courtesy of Shutterstock.